

Dashboard
Your landing screen: how much your recommendations have earned, which ones are pulling their weight, and a one-click way to build the next one.
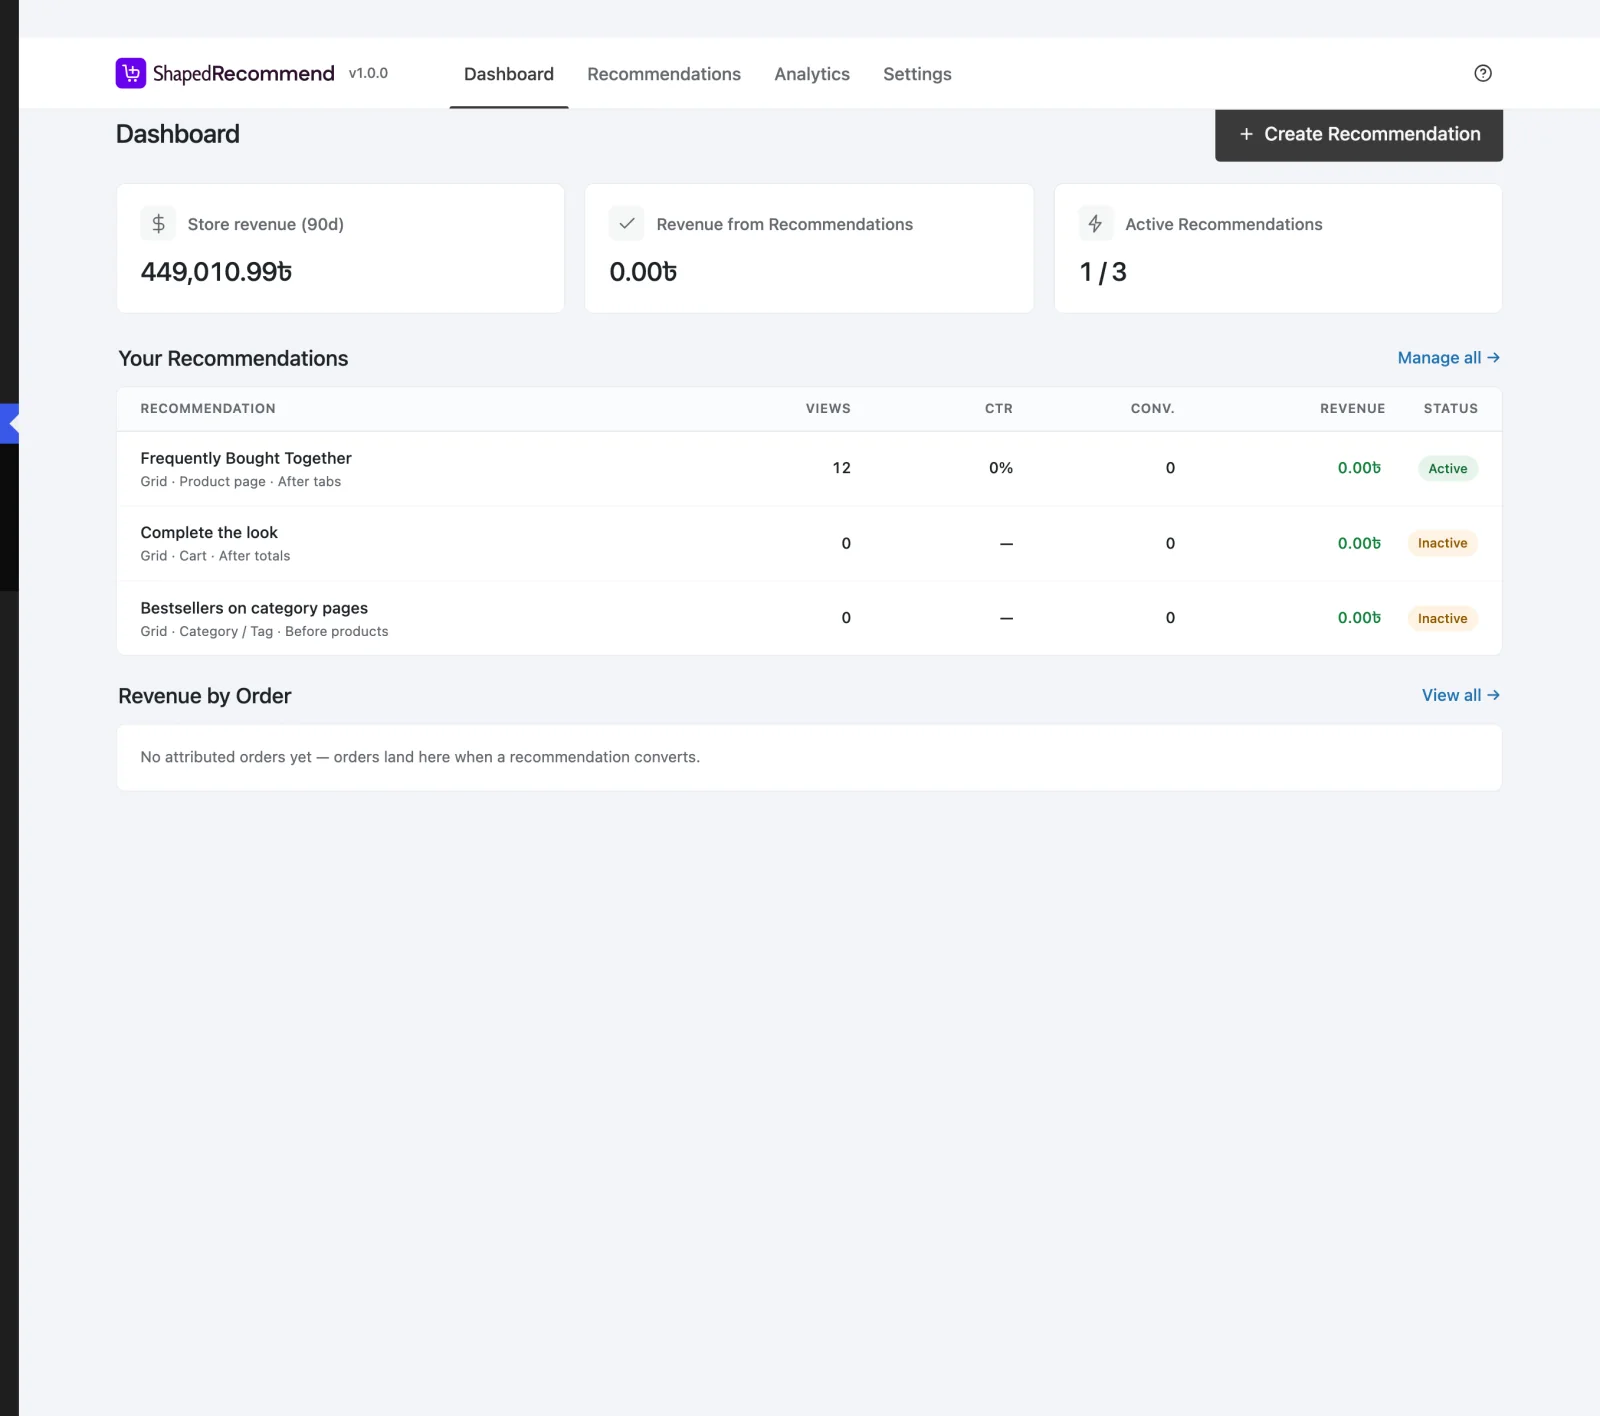
Click Recommend in the WordPress sidebar and this is where you land. (The Dashboard has no row of its own in the sidebar — the top-level Recommend link is the Dashboard.) You can also reach it from the Dashboard tab at the top of every Shaped Recommend screen.
The Dashboard is read-only. It's for checking in, not configuring: every row and link takes you to the screen where the real work happens.
Before your first Recommendation
On a store with no Recommendations yet, the Dashboard is mostly a welcome panel:
Recommend What Shoppers Want Next — "Show related products, upsells and bundles on product, category, cart and thank-you pages — picked by your own rules or your store's order history."
Create a Recommendation opens the template picker. The three stat cards sit underneath; the two tables don't appear until there's something to put in them.
There's nothing to dismiss. The panel disappears by itself the moment your first Recommendation exists, and from then on the page title carries a Create Recommendation button instead.
The three stat cards
| Card | What it shows |
|---|---|
| Store revenue (90d) | Your whole store's revenue over the last 90 days, as WooCommerce Analytics measures it. It's there for scale, so the next number has something to sit against. |
| Revenue from Recommendations | Everything your Recommendations have ever earned — order value the plugin attributed to a recommendation click. This one is lifetime, not 90 days. |
| Active Recommendations | Live Recommendations out of the total, as n / total. "3 / 7" means seven built, three switched on. |
Two things worth knowing:
- They're never filtered. The Dashboard doesn't pick up the date range or filters you chose on Analytics. It's a fixed snapshot, not another report to configure.
- A dash means "can't be measured", not zero. If a figure isn't available to you — say WooCommerce Analytics is turned off, or your account isn't allowed to see analytics — it shows —. Hover it and you'll read "This figure isn't measurable on this store yet." A confident
$0.00there would be a lie.
Your Recommendations
Your top four Recommendations, ranked the same way the Analytics table ranks them: by revenue, then by views. On a store where nothing has been measured yet, you'll see the four most recently edited instead.
Each row shows:
- The name, and under it what it is and where it shows — "Grid · Product page · After tabs"
- Views, CTR, Conv. and Revenue
- Its status: Active or Inactive
Click a row to open it in the builder. Manage all → takes you to the full Recommendations list.
Revenue by Order Pro
The ten most recent orders your Recommendations earned, with Order, Date, Customer, Recommendation and Revenue.
This is the panel that answers "did it actually make money?" in terms of real orders rather than percentages. Click an order number to open the order (if your account can edit orders). An order that two Recommendations both contributed to appears twice, once for each, with the revenue each one earned. A Recommendation you've since deleted shows as (deleted) — the money was still real.
Until something converts, it says "No attributed orders yet — orders land here when a recommendation converts." View all → opens the full, filterable report on Analytics.
In Free, the panel is locked: "Revenue by Order is Pro — See exactly which orders each recommendation drove, filterable per recommendation." Its View all → opens the same upgrade prompt.
What the numbers mean
The same definitions as the Analytics screen:
| Figure | Means |
|---|---|
| Views | Times the block was shown to a shopper. |
| CTR | The share of views where the shopper clicked something in the block. How appealing the offer looks. |
| Conv. | Conversions — orders that included a product the shopper clicked in the block. How often it actually sells. |
| Revenue | Order value attributed back to a recommendation click. |
Every one of them comes from a logged event. Nothing is estimated with a multiplier. And delayed purchases still count: a shopper who clicks a recommendation today and checks out tomorrow is still attributed. How attribution works has the details.
Who can see what
The Dashboard opens for anyone who can manage Recommendations — Administrator and Shop manager by default. The figures on it also need the sprcm_view_analytics capability, which both roles get too.
If someone's account can manage Recommendations but has had analytics access removed, they'll still see the cards and the list, with every figure shown as —, and the Revenue by Order panel won't appear at all. "Not allowed to see" and "nothing measured" stay different answers.
Next
- Recommendations List — every Recommendation and what you can do with it.
- Analytics — date ranges, the chart and the full reports.
- Starting Templates — what Create a Recommendation opens.