

Analytics
Are your recommendations actually earning anything? This screen answers that with numbers you can trace back to real shopper activity.
Recommend → Analytics in the WordPress sidebar, or the Analytics tab at the top of any Shaped Recommend screen. If you already read WooCommerce's own Analytics reports, this will feel familiar: the same metric names, the same "this period vs the one before" comparison.
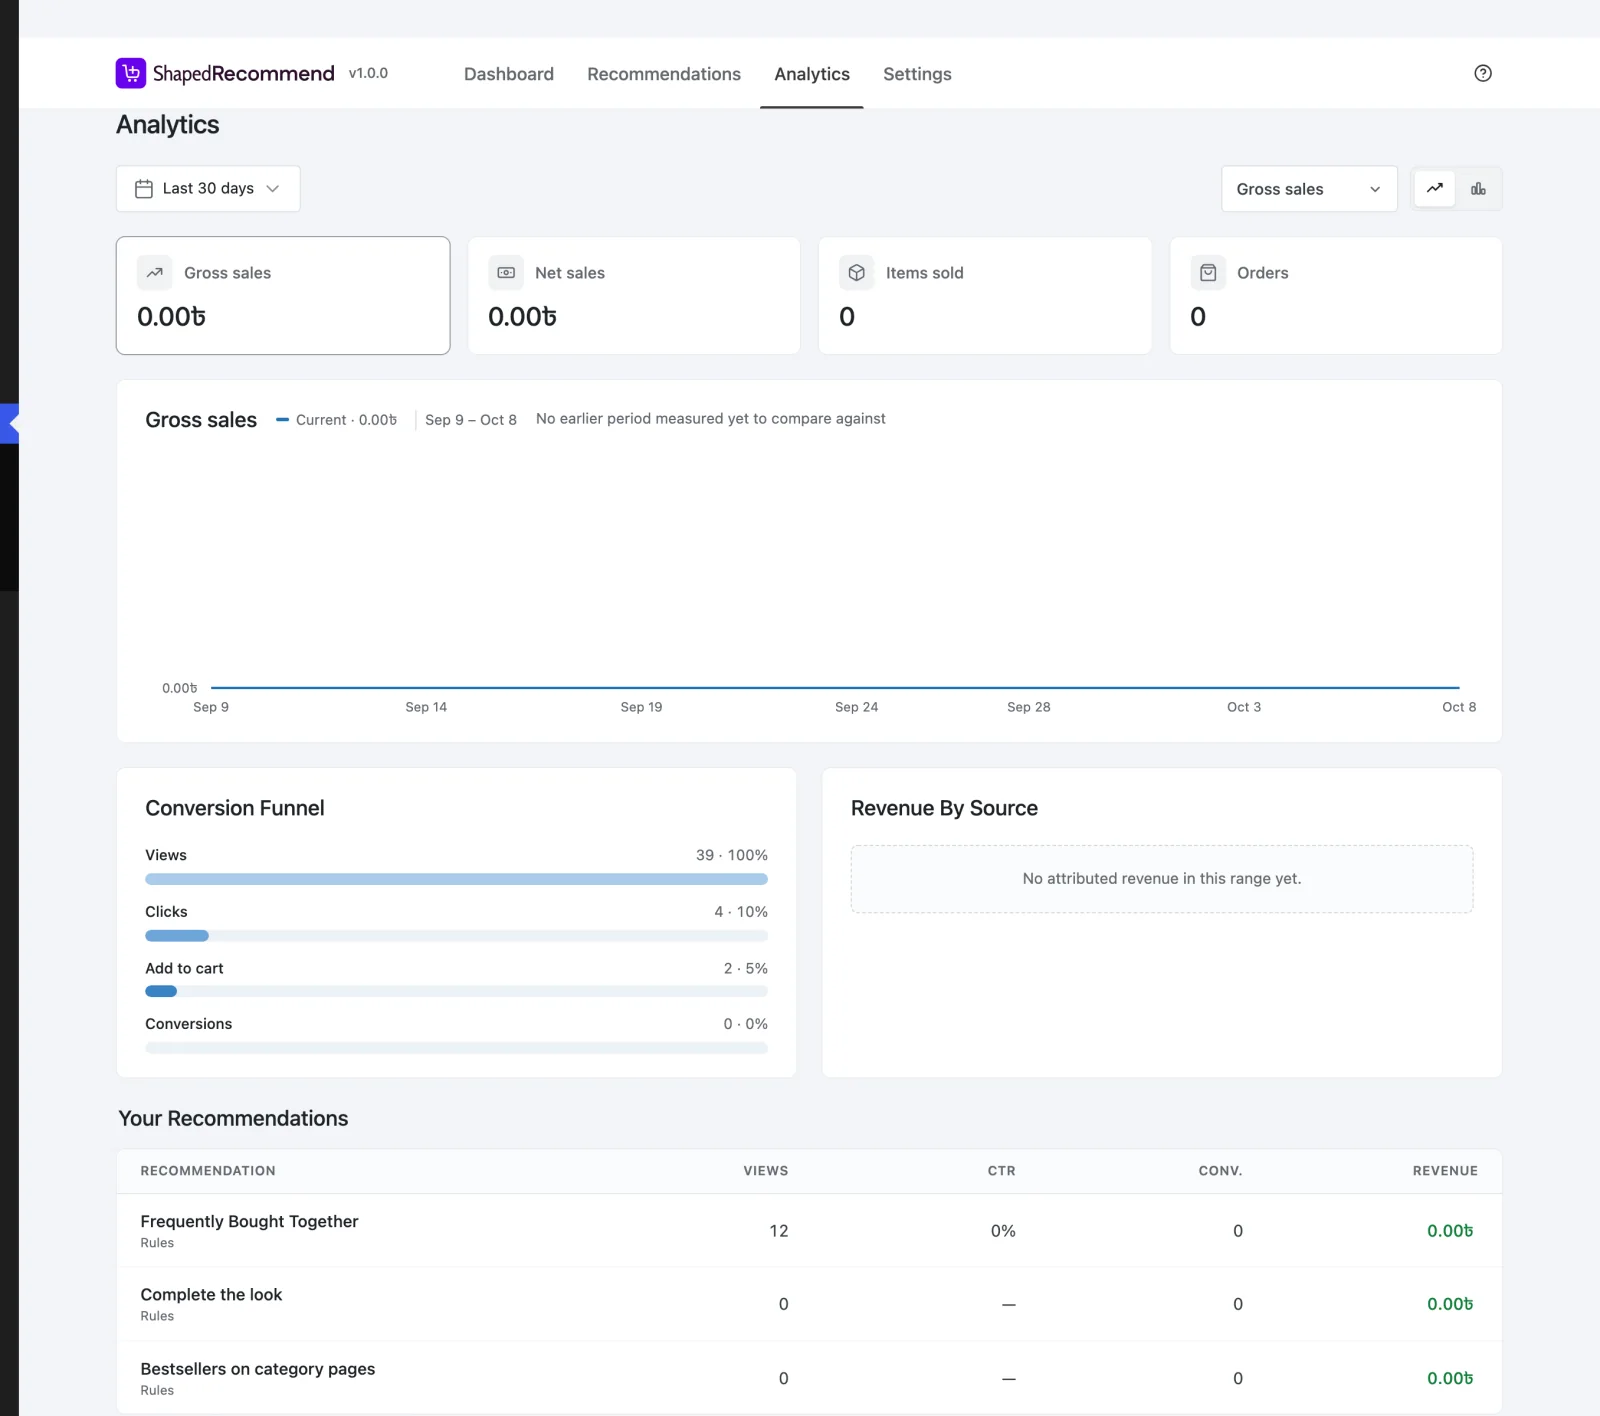
Reading the screen, top to bottom
- Pick a date range (top left).
- Scan the four tiles — what your recommendations sold in that range, and how that compares with the period before.
- Read the chart for the shape over time.
- Check Your Recommendations to see which ones did the earning.
- In Pro, dig into the four extra reports.
Date ranges
| Range | Tier |
|---|---|
| Last 7 days | Free |
| Last 14 days | Free |
| Last 30 days (default) | Free |
| Last 90 days | Pro |
| Last 12 months | Pro |
| All time | Pro |
| Custom range | Free up to 30 days · Pro any length |
Custom range opens a calendar (Choose a date range): click a start day, click an end day, then Apply. In Free, the calendar won't let you pick a span longer than 30 days, and the server refuses one too — it's never quietly trimmed.
Locked ranges stay visible in Free; choosing one opens the upgrade prompt.
Every range is a real window. All time measures from the first day your store has data, not a 90-day window with a different label. Each range is compared with the same length of time just before it — the last 30 days against the 30 days before that, not against "last month".
The four metrics
| Metric | What it counts |
|---|---|
| Gross sales | Order value attributed to your recommendations, before refunds and deductions |
| Net sales | The same, after refunds and the deductions WooCommerce leaves out of net sales. Read from the actual order — never worked out as a percentage of gross |
| Items sold | Units, not orders |
| Orders | Distinct orders a recommendation contributed to |
Money is formatted by WooCommerce itself, so your currency, decimals and separators are respected.
If an order is refunded later, the figures for that day are recalculated — so a number can go down, which is exactly what should happen.
The tiles
Four tiles — Gross sales, Net sales, Items sold, Orders — each with a chip showing the change against the previous period (+12%, −4%).
- Click a tile to plot that metric on the chart. The Metric dropdown above the chart does the same.
- No chip at all means the previous period is from before your store started collecting data, so there's nothing to compare with. Every new install spends its first couple of ranges like this.
- A dash (—) means the previous period was measured but was zero, so a percentage would be meaningless. Hover it: "Nothing was measured in the previous period, so there is no change to show."
The chart
A line chart (the default) or a bar chart — switch with the two icons at the top right. It plots the current period, with the previous period as a dashed line for comparison. The legend names both with their totals: Current · $1,240.00 and Previous · $980.00. Before there's an earlier period to compare against, it says "No earlier period measured yet to compare against".
Hover any point for that day's figures. Press Escape to close the tooltip.
Your Recommendations
Every Recommendation's performance for the selected range, highest revenue first:
| Column | Means |
|---|---|
| Recommendation | The name, and under it Rules or Statistics — whether products are picked by your rules or from your order history |
| Views | Times the block was shown to a shopper |
| CTR | The share of views where the shopper clicked something in the block |
| Conv. | Conversions — orders containing a product the shopper clicked in the block |
| Revenue | Attributed order value |
Every Recommendation you have is listed, even one with nothing measured yet — that zero row is often the one you came to check. A deleted Recommendation stays in the table, as (deleted) with Removed under it, if it earned something in the range: the revenue was real. Deleted ones with nothing in the range are left out.
A CTR of — means there's nothing to divide yet (no views), or the figures date from before the plugin tracked block-level clicks.
Pro reports Pro
Four more panels. In Free each shows as a locked card with its name and a short pitch — no fake example figures behind the lock. In Pro they're live, and the two summaries move up above the Your Recommendations table.
Conversion Funnel
How far shoppers get, in four stages: Views → Clicks → Add to cart → Conversions. Each stage is its own logged event and shows the share of views that reached it. Nothing is calculated from the stage below, so if your shoppers behave unusually, the funnel shows it.
Clicks counts blocks that were clicked, not individual product clicks — so a shopper opening three products from one bundle counts once, and the funnel can't get wider as it goes down.
Revenue By Source
A ring chart splitting attributed revenue between Rules and Statistics (Recommendations that pick products from your order history), with each share and the Total in the middle. The total matches the Gross sales tile. A source that earned nothing in the range isn't drawn. Empty ranges say "No attributed revenue in this range yet."
Revenue by Order
Every order your Recommendations earned in the range — Order, Date, Customer, Recommendation, Revenue — newest first, paged.
- Filter by recommendation (top right of the panel) narrows it to one Recommendation. Deleted ones stay in the filter, marked (deleted).
- An order two Recommendations both contributed to appears twice, once per Recommendation, each with its own revenue.
- Each row shows revenue in that order's own currency.
- The order number links to the order (opening in a new tab) if your account can edit orders.
The Dashboard shows the latest ten of these same rows, unfiltered. Filtering here never changes the Dashboard.
Daily Sales Report
One row per day of the range: Date, Items sold, Gross sales, Net sales, Orders and Products (how many different products sold). Newest day first, and every column is sortable — sort by Gross sales to find the days that mattered. Days with no sales are listed as zero rather than skipped, so a quiet week doesn't look like a short one. A range with no sales at all just says "No sales measured in this range yet."
On the WooCommerce order screen
Pro also adds a Recommendation attribution box to the order edit screen in WooCommerce. It lists each Recommendation that earned something on that order, with its ID and the revenue attributed to it, and labels each line item it earned with "via {name}". The box only appears on orders that a Recommendation actually contributed to.
When there's nothing to show yet
- No Recommendations at all: the tiles and chart still appear, and the rest of the page is replaced by "Coming once data arrives:" with a list of the sections you'll get.
- Recommendations, but nothing measured in this range: "No data yet for this range — views, clicks and revenue appear here as shoppers browse." The figures below are honest zeros.
How attribution works
Worth understanding, because it decides what every number here means:
- A shopper sees a block → a view is logged.
- They click a product in it → a click is logged, and the click is remembered against their shopping session.
- They add something to the cart → add to cart is logged (recorded by your store, not reported by the browser).
- They place an order containing a product they clicked → a conversion is credited to the Recommendation that drove the click.
Delayed purchases still count. A click is remembered for up to 48 hours, as long as the shopper's WooCommerce session is still alive. Someone who clicks today and buys tomorrow is attributed. A purchase after their session has ended is left unattributed rather than guessed at.
One order can credit more than one Recommendation: each gets the revenue from the lines it earned.
The integrity rule
Every number on this screen traces to a logged event. There are no funnels made up by multiplying, no invented source splits, and no net sales figure calculated as a fixed percentage of gross. That's why you'll sometimes see — or "This figure isn't measurable on this store yet" where another tool would show something plausible.
Where the numbers come from
- Events — views, clicks, add-to-carts and conversions — are recorded as they happen.
- A nightly job rolls them up into daily totals, which is what this screen reads. That keeps it fast on a busy store. Today's figures are brought up to date whenever you open a range that includes today, so you don't have to wait until tomorrow to see a new Recommendation working.
- Raw view, click and add-to-cart events are deleted after 90 days. Conversions are kept indefinitely, and so are the daily totals — so your history doesn't disappear with the raw records. (Developers can change the 90 days with the
sprcm_events_retention_daysfilter.)
Empty history on a busy store usually means scheduled tasks aren't running
The nightly rollup runs through WooCommerce's scheduled-actions system, which needs WP-Cron (or a real server cron) to fire. If your host has disabled WP-Cron without setting up a replacement, today's figures will show but past days never get rolled up. See Troubleshooting.
Who can see it
Analytics needs the sprcm_view_analytics capability, which Administrator and Shop manager get by default. Someone without it won't see the Analytics menu item, and opening the screen directly shows "This screen is not available".
The filters and pages you pick here stay on this screen — they never change what the Dashboard shows.
Next
- Dashboard — the unfiltered snapshot.
- Best Practices — reading these numbers without fooling yourself.
- Free vs Pro — everything Pro adds.